Electoral boundaries – using an outdated estimate of an inappropriate measure (Stephen Clark)
Author: Stephen Clark. The data used in this post are available here (WPC) and here (PWC).
The R script used to do the analysis is available here.
In this article I am going to examine the consequences of using a measure of the population based on registered electors to define the boundaries of parliamentary constituencies in England and Wales.
The Boundary Commissions for England[1] and Wales[2] recently published proposals for new Westminster Parliamentary Constituencies (WPC). The purpose of this review is to address issues around the inequality of the size of the electorate in each constituency and also to reduce the number of such constituencies in the United Kingdom from 650 to 600. The task in England and Wales is to reduce the number of constituencies to 530 (501 in England and 29 in Wales), with a target electorate of no fewer than 71,031 and no more than 78,507 electors. The information on the number of electors in a location is taken from the December 2015 register of electors. These are the rules that the UK boundary commissions are required to follow by law.
In the run up to the 2016 European Referendum it is reported that an additional 2 million people registered to vote in the referendum. Because of the earlier cut-off date in late 2015, these electors will not be included in the calculations used by the Boundary Commissions to re-draw the boundaries. This has been challenged by some commentators[3]. There are also additional concerns around ignoring those who are not registered to vote, but are still resident within the parliamentary constituency. These people still expect to be able to go to their local Member of Parliament (MP) to lobby them or gain redress against perceived injustice from government authorities. If an MP has a sizeable population of unregistered voters then their workload will be high. This has led some to say that not only should the “missing” 2 million be included in this re-drawing of boundaries, but also the total adult population in the local area should be used. An argument against this is that it is difficult to know how many people there are living in a local area (the UK has no central population register) but with registered electors it is known precisely where they live. Another argument is that the adult population includes some transient foreign nationals who are never entitled to register to vote – to include these over-states the longer term stable population of an area. (Although MPs do routinely take up case work from foreign nationals who are unable to vote in the UK).
Here I will attempt to estimate the size of the population in each of the proposed WPCs in England and Wales. In light of the lack of accurate and contemporary population data mentioned above, I will use instead population estimates for small areas published by the Office for National Statistics[4]. These are Mid-2014 population estimates for Census Output Areas (COA) published in late November 2015. There are 181,408 such COA covering England and Wales. A spatial best-fit in ArcMap is used to allocate each COA to a proposed WPC[5] using the population weighted centroid of the COA[6]. The lookup of these 181,408 to parliamentary constituency is provided here as a .csv file. The R script to merge the ONS population estimates and the COA lookup and then aggregate across the proposed WPCs is given here.
The results are collected together here. It contains separate sheets for the estimated male and female population by single year of age (with a 90 years or older upper band) in each proposed WPC. There is also a sheet that allows a constituency to be picked in cell A1 and the estimated population structure to be displayed. Here I show the estimated population structure of the new Derby South and North constituencies. Derby North covers much of the multi-cultural city of Derby whilst Derby South covers a lot of Derby’s more rural hinterland.
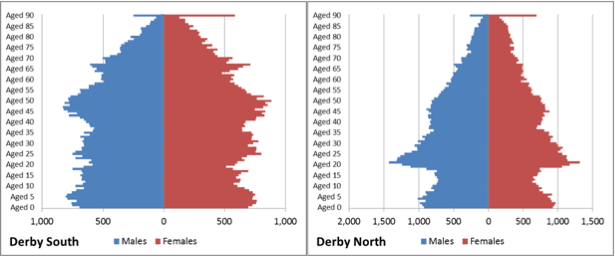
Derby South has a fairly typical population structure, containing a bulge of those aged 45 to 55 (“baby boomers”) followed by a dent (“baby bust”). The population at older ages tapers down, but does contain a post World War II fertility spike. The structure for Derby North is very different. Here there is a sizeable younger population aged 20 to 30 and the baby boomers are not much in evidence. Given that there are well documented differences in registration, turnout and party voting rates across the generations[7], such diagrams allows campaign material to be targeted to appeal to a majority group within the WPC and estimates to be made about the likely turnout in elections and what target vote a politician may need to be elected.
Returning to the initial question about the impact of using the December 2015 registered electors and ignoring those who registered early in 2016 or who are still not registered, the figure below plots the estimated Mid-year 2014 population aged 18 and older in each proposed WPC (the potential demand for an MPs services) against the December 2015 registered electors.
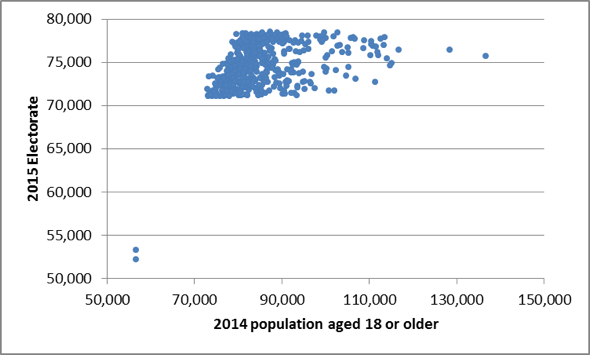
The electorate population sits neatly within the prescribed bands[8] (by definition) whilst the adult population ranges from 73,000 to 137,000. Those constituencies with the highest adult populations are shown in this table.
| Proposed Constituency | Males aged 18 or older | Females aged 18 or older | Aged 18 or older | 2015 Electorate |
| Cities of London & Westminster | 74,418 | 62,256 | 136,674 | 75,693 |
| Kensington and Chelsea | 62,964 | 65,457 | 128,421 | 76,454 |
| Newcastle upon Tyne East | 61,010 | 55,771 | 116,781 | 76,406 |
| Poplar and Limehouse | 61,083 | 54,074 | 115,157 | 74,863 |
| Tottenham | 57,995 | 56,772 | 114,767 | 74,648 |
| Hackney West and Bethnal Green | 58,544 | 55,463 | 114,007 | 75,449 |
| Willesden | 56,809 | 56,696 | 113,505 | 77,841 |
| Leeds Central | 56,720 | 56,570 | 113,290 | 77,012 |
| Liverpool Riverside | 57,737 | 54,884 | 112,621 | 77,665 |
| Hampstead and Golders Green | 54,418 | 57,732 | 112,150 | 75,774 |
These constituencies are typified by those that have a high potential count of non-UK citizens resident and therefore unable to register to vote (the London constituencies) or constituencies with high young and student populations who are least likely to register (Newcastle upon Tyne East, Leeds Central and Liverpool Riverside – and Oxford East is just outside the top 10). However, as stated earlier, just because these people are not registered does not mean that they do not call upon the services of the local MP. The ratio of the estimated adult population to the electorate provides some indication of the potential additional workload an MP might face. This ratio is mapped here.
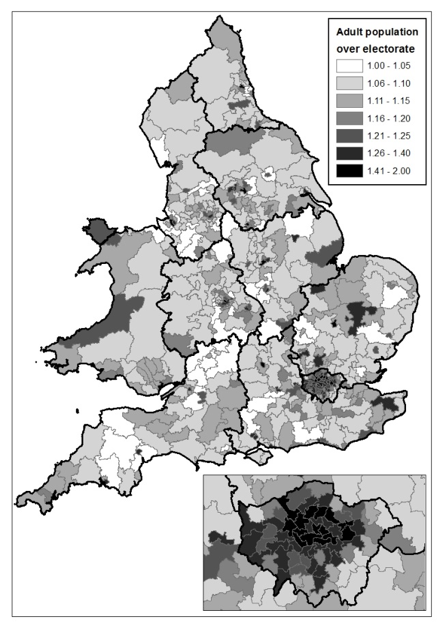
The proposed WPCs in London have a high value for this ratio, indicating a large potential workload for such MPs, whilst the more rural WPCs have low values for this ratio.
After this analysis, I believe that there is a case to be made that basing the boundaries of the proposed parliamentary constituencies on an outdated estimate of an inappropriate measure defeats the original intention of the re-drawing of the boundaries – to even out the workload on MPs. Our democracy will not be best served if MP’s workloads, whilst they are in their constituencies and as determined by their residents, varies by the degree outline here.
[Update : 26th October 2016] This analysis has used the ONS’ 2014 estimates of mid-year populations for small areas. More recent, 2015 estimates, are available here: https://www.ons.gov.uk/peoplepopulationandcommunity/populationandmigration/populationestimates/bulletins/smallareapopulationestimates/mid2015. Using the lookup Population Weighted Centroid (PWC) to Westminster Parliamentary Constituency (WPC) csv file and the R-script, the interested reader may update these results to mid-year 2015.
References
[1]2018 Review. http://boundarycommissionforengland.independent.gov.uk/2018-review/
[2]2018 Review of Parliamentary constituencies. http://bcomm-wales.gov.uk/2018-review/?lang=en
[3]Labour wants Commons constituency shakeup to be based on new data. http://www.theguardian.com/politics/2016/sep/11/labour-delay-boundary-commission-constituency-changes
[4] Annual Small Area Population Estimates: Mid-2014 and Mid-2013http://www.ons.gov.uk/peoplepopulationandcommunity/populationandmigration/populationestimates/bulletins/annualsmallareapopulationestimates/mid2014andmid2013
[5] All 501 constituencies - Initial proposals geospatial data. https://www.bce2018.org.uk/publications and Initial proposals shapefile https://www.bcw2018.org.uk/publications
[6] Output Areas (December 2011) Population Weighted Centroids http://geoportal.statistics.gov.uk/datasets/ba64f679c85f4563bfff7fad79ae57b1_0
[7] How Britain voted in 2015. The 2015 election – who voted for whom? https://www.ipsos-mori.com/researchpublications/researcharchive/3575/How-Britain-voted-in-2015.aspx
[8] But not the two (small) Isle of Wight constituencies which are difficult to merge or to combine with a mainland portion.
Data Used
WPC: https://docs.google.com/spreadsheets/d/1OpSbTZ_bxd6NDCvZi8lBbldAChpufmtMmkv2550wkIc/edit?usp=sharing
PWC_in_EW:https://docs.google.com/spreadsheets/d/1Sq2vlXkvGBf1U6pYKABVugKImgMv2ZBcYj6-17VYGZw/edit?usp=sharing