Faster, Higher, Stronger - Diversity in the Olympics (Stephen Clark)
Author: Stephen Clark. The data used in this post are available here.
Undoubtedly the Olympics are a global phenomenon which aims to promote ideals that reach beyond pure sporting endeavour. In ancient times truces were called whilst the Olympics were ongoing[1] and today nations believe that they can derive a great deal of prestige or soft power from the games (or not[2]), either by hosting the games or by participation. So, a “good” performance in the games is highly prized and countries can adopt various strategies to maximise the performance of their competitors. In the more developed countries this usually involves generous funding that allows: competitors to train full time; to build world class venues for training; pay coaching staff attractive salaries and raise the profile of sports in the country. Competitors from less developed countries however face more challenges and rely more on more innate abilities. This has led to some to publish alternative medal tables from the Olympics that take account of the country’s population or national income[3]. Such measures promote smaller, poorer nations up the final medal table – for Rio 2016 tiny Grenada (population: 107k) finishes top on many of these measures[4].
Here I show a different measure of Olympic success that accords with the Olympic ideal of “Faster, Higher, Stronger” and looks at how diverse is the medal haul of each country. Here I am measuring diversity in terms of the representativeness (or not) of each sporting discipline to the total medals received by each nation. This is motivated by the idea that a strategy may be adopted by a country to specialise in just a few disciplines that have many medals on offer. For example in Rio 2016, the USA gained 35% of its gold medals from swimming and 28% from athletics. To measure this I am using a measure of diversity commonly used in the ecological and demographic spheres[5]. The formulae used here is the Gini-Simpson’s index.
Where: pc,i=proportion of medals won in discipline i by country c.
So
and
The higher the value of λc the more diverse is the country’s medal haul – its medal are not all won in a just a few sports disciplines.
The data used in here are taken from the BBC web site which provides counts of medals won by type of medal for each Olympic discipline[6]. The diversity indices for each country is calculated using counts of medal by: type (gold, silver, bronze); total medals; and a weighted medal scheme (with weights of 4 for gold, 2 for silver and 1 for bronze). I have also made the data available here.
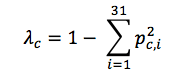
This table shows which countries were the most diverse in their medal haul using each of the four measures of success.
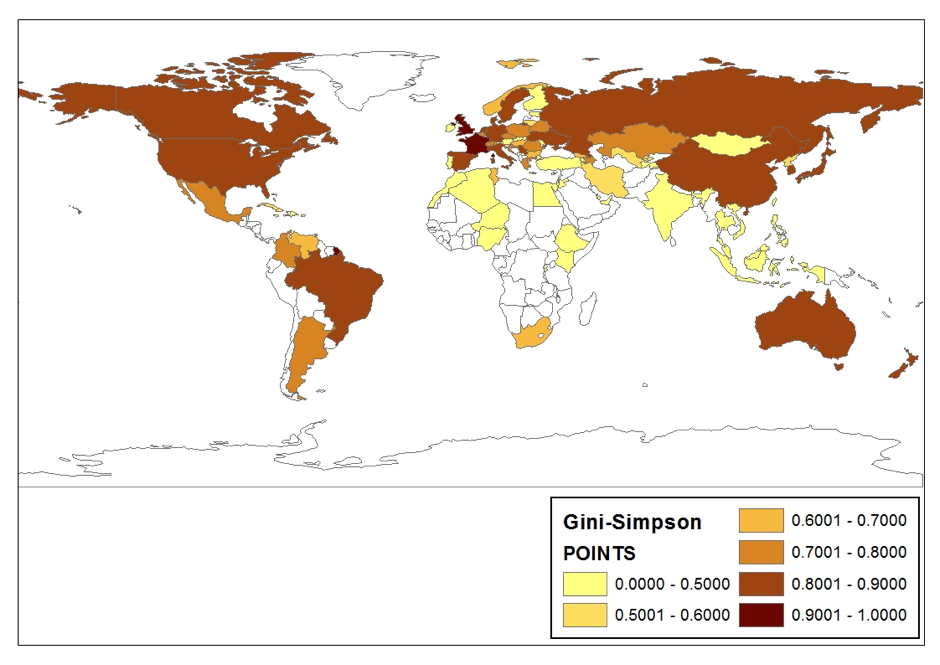
In this table the USA loses its traditional top spot in such tables whilst China recovers some of its pride by been the most diverse country in the silver medal and total medal rankings. Great Britain and Northern Ireland is the most diverse country when looking to win the prestigious gold medals and this performance, together with a relatively high weighting for gold in the points system, also puts Great Britain and Northern Ireland at the top of the points classification. Serbia, which finishes 32nd on a traditional ranking, performs well in the points classification, its relative small haul of eight medals are well distributed amongst seven disciplines. The Russia Federation also performs well, given that they had a large number of their competitors in some disciplines affected by bans.
This map shows the global distribution of the points diversity index.
After the 2012 London Olympics, many media organisations highlighted the contribution of the great county of Yorkshire to Great Britain’s success in the games[7]. Here the notion of Yorkshire as an independent country is employed to see how the county performs in this diversity measure and how this also impacts on the results for the rest of Great Britain and Northern Ireland (rGB and NI). Yorkshire competitors won 5 gold medals (in boxing, cycling, diving, rowing and triathlon), 5 silver (athletics, diving, gymnastics, rowing and triathlon) and 4 bronze (badminton, cycling, gymnastics and triathlon). The table below provides these revised calculations.
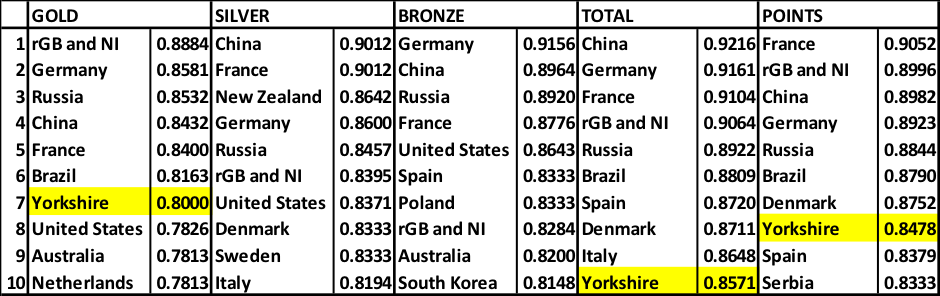
Even without the support of Yorkshire, the rest of Great Britain and Northern Ireland still retains the top spot for gold medals. Also on golds, Yorkshire by itself finishes between the hosts Brazil and one spot above the sporting super power of the United States. Without Yorkshire however, the rest of Great Britain and Northern Ireland loses the top spot for points to France.
Clearly this approach is not a perfect way to measure Olympic success (is there such a way?). Countries with few medals will, unavoidably, have all their medals concentrated in a just a few disciplines and thus have a low Gini-Simpson index. Each sports discipline also provides a different number of medals, so a country that does well in both golf (just two golds available) and swimming (thirty five golds available) cannot hope to achieve an equality of distribution between these two disciplines.
Even with these issues (which can be addressed using some percentage or arbitrary weighting mechanisms) this analysis show that not all nations aspire equally to the ideal of being the fastest, highest and strongest.
Author: Stephen Clark. The data used in this post are available here.
[1] Olympic Truce. https://en.wikipedia.org/wiki/Olympic_truce
[2] Great fall of China: Beijing's Olympians fail to reach highs of previous Games. https://www.theguardian.com/world/2016/aug/16/great-fall-of-china-beijings-olympians-fail-to-reach-highs-of-previous-games
[3] No money, no medals. http://visual.ons.gov.uk/no-money-no-medals/
[4] Medals per Capita. http://www.medalspercapita.com/
[5] Diversity index. https://en.wikipedia.org/wiki/Diversity_index
[6] Medal Table. http://www.bbc.co.uk/sport/olympics/rio-2016/medals/countries
[7] Rio Olympics 2016: Four years on from London, can Yorkshire triumph again? http://www.bbc.co.uk/sport/olympics/36968614